
Category:Diagrams from FAO publications in English
Media in category "Diagrams from FAO publications in English"
The following 40 files are in this category, out of 40 total.
-
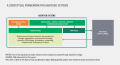 A conceptual framework for agrifood systems.svg 507 × 273; 143 KB
-
.svg/120px-A_conceptual_framework_for_Food_Loss_and_Waste_(FLW).svg.png) A conceptual framework for Food Loss and Waste (FLW).svg 507 × 417; 277 KB
A conceptual framework for Food Loss and Waste (FLW).svg 507 × 417; 277 KB
-

-

-
 Agrifood systems emissions 2021.svg 512 × 597; 177 KB
-

-

-
 Components of the world’s land use and net changes, 2001–2023.svg 512 × 337; 136 KB
-
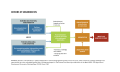
 Drivers of agricultural land use and management.svg 512 × 421; 191 KB
-
 Drivers of urbanization.svg 512 × 304; 184 KB
-
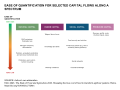 Ease of quantification for selected capital flows along a spectrum.svg 512 × 384; 287 KB
-

-
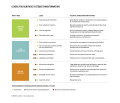
 Five commonly used functional units, their scope and relevance.svg 512 × 433; 392 KB
-
 Food security and nutrition dimensions and determinants.svg 512 × 233; 89 KB
-

-

-
 Human-induced land degradation, 2020.svg 512 × 306; 170 KB
-
 Keeping momentum to achieve the 2030 Agenda.svg 512 × 351; 228 KB
-
 Key characteristics of anticipatory action.svg 512 × 344; 218 KB
-
 Key indicators of land degradation tracked by SDG target 15.3.svg 512 × 500; 80 KB
-
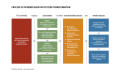
 Levers for agrifood systems transformation.svg 512 × 436; 321 KB
-
 One Health.svg 1,120 × 800; 255 KB
-
 Patterns of urbanization.svg 512 × 389; 132 KB
-
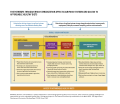
 Process of informed agrifood systems transformation.svg 512 × 314; 232 KB
-
 Proportion of carbon stock in forest carbon pools, 2020.svg 512 × 230; 18 KB
-

-

-
 SOFI2024 EN figure-15.svg 718 × 763; 421 KB
-
 SOFI2024 EN figure-16.svg 718 × 521; 286 KB
-
 SOFI2024 EN figure-19.svg 718 × 550; 954 KB
-
 SOFI2024 EN figure-20.svg 718 × 451; 212 KB
-
 SOFI2024 EN figure-30.svg 718 × 477; 457 KB
-
 SOFI2024 EN figure-33.svg 718 × 624; 761 KB
-
 SOFI2024 EN figure-34.svg 718 × 619; 367 KB
-
 Spectrum of land degradation and restoration pathways.svg 512 × 244; 40 KB
-

-
-
 The role of scenarios in informing policymaking.svg 512 × 386; 231 KB
-

-
 Two-phase agrifood systems assessment process.svg 512 × 393; 116 KB

.svg)


